
By Rami Kuret, Product Manager, Autodesk Platform Services
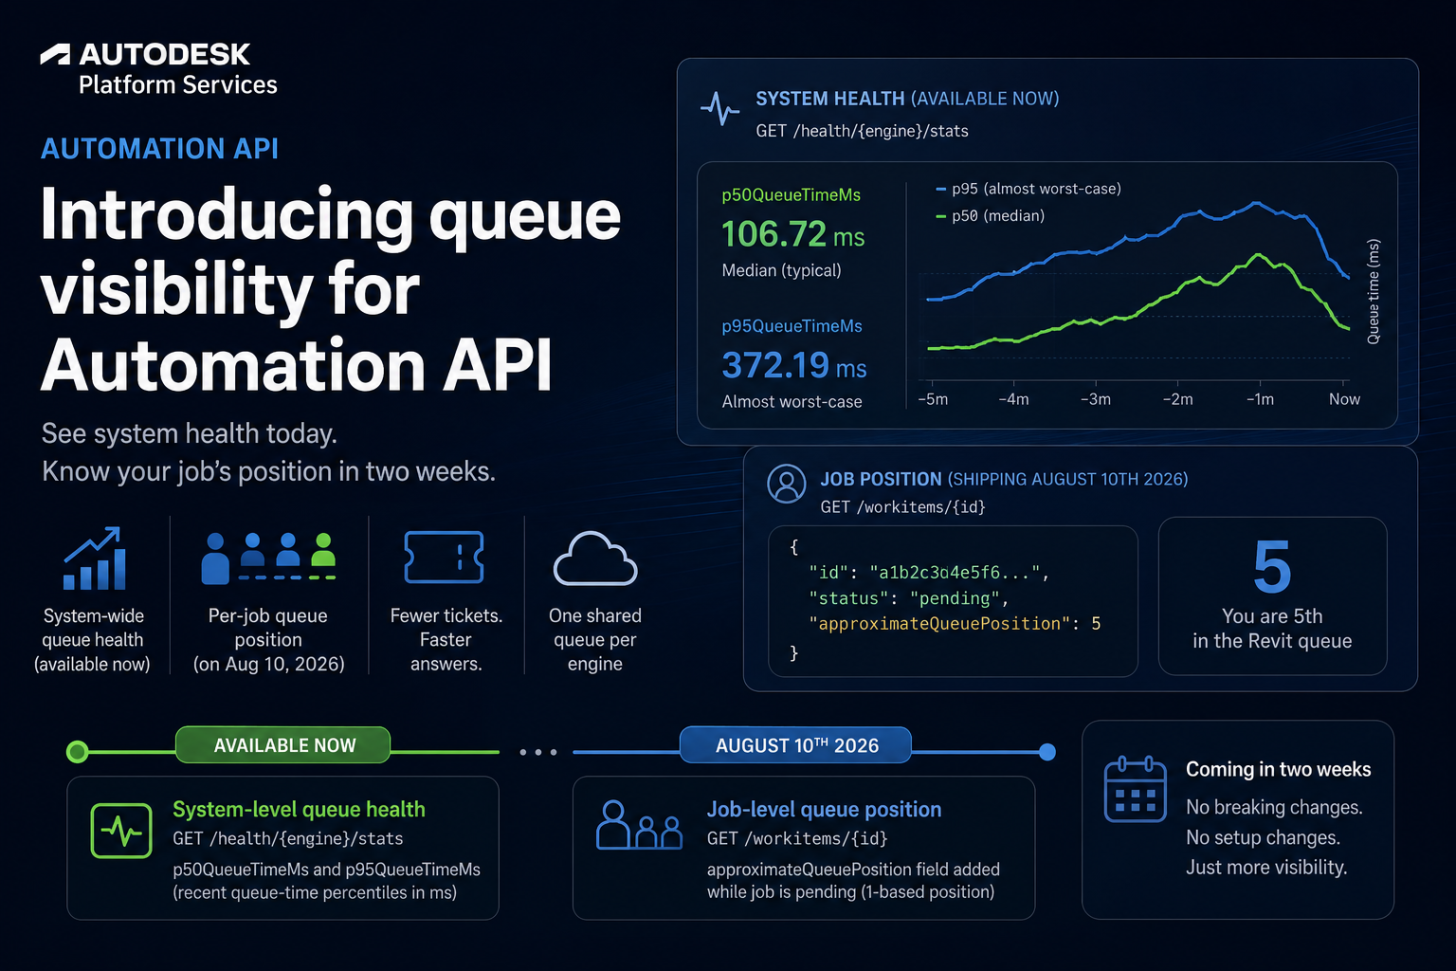
Automation API is adding queue visibility. System-wide queue health metrics are live today, and a new per-job queue position field ships a Public Beta in two weeks, August 10th 2026 to gather feedback.
Today, when you submit a workitem and poll GET /workitems/{id}, a pending status is all you get. You can’t tell whether the system is busy, whether your job is stuck, or whether a delay is on Autodesk’s side or your own.
Queue visibility addresses this, and we’re delivering it in two steps.
- System-level queue health metrics are live today: query recent queue-time percentiles for any engine to see whether the system is running smoothly or under load.
- Job-level queue position, which tells you approximately where your workitem stands while it is pending, ships in two weeks as a new
approximateQueuePositionfield onGET /workitems/{id}. We’re announcing it now, ahead of the change, so you have a two-week window to adapt if you need it.
(Automation API lets developers run Revit®, AutoCAD®, Inventor, 3ds Max, and Fusion plugins and workflows programmatically in the cloud on a pay-per-result basis.)
What does this mean for you?
- See system health today. Query
GET /health/{engine}/statsright now. It returns two fields,p50QueueTimeMsandp95QueueTimeMs, giving recent queue-time percentiles in milliseconds for the engine you specify. No code changes, no new parameters. - Know your job’s position in two weeks. In two weeks,
GET /workitems/{id}will include a newapproximateQueuePositionfield on pending workitems, reporting approximately where a job stands, for example5for 5th in the Revit queue. The field is additive, but if your integration uses strict JSON parsing that rejects unknown fields, update it to tolerate new fields within the two-week window. Most clients, including standard .NET and Node integrations, already ignore unrecognized fields and need no changes. - Reduce support tickets. Your operations team can distinguish a local problem from an Autodesk-side delay, and act on queue position directly.
Why we built this
Automation API powers mission-critical workflows for many teams, and queue visibility is a frequent customer request. When a job sits in pending with no additional information, teams open support tickets and pause rollouts, even when the system is operating normally.
With real-time visibility into system state, you can plan around load, troubleshoot faster, and scale automation in production more confidently.
How it works
Queue visibility comes from two additions, arriving in two phases: a new endpoint for system-level health, and a new field on an existing endpoint for job-level position.
1. System-level queue health (available now)
The GET /health/{engine}/stats endpoint returns queue-time percentiles over the last 5 minutes for a single engine, so you can read system-wide queue behaviour without polling individual jobs. It supports the same engines as the rest of Automation API: AutoCAD, Revit, Inventor, Fusion, and 3dsMax. The response contains two fields, both in milliseconds:
p50QueueTimeMs(median): the “typical” experience. Half of jobs waited less than this value in the last 5 minutes.p95QueueTimeMs: what an almost worst-case request experiences, excluding only the slowest 5%.
A quick example, checking Revit queue health:
curl -H "Authorization: Bearer $TOKEN" \

  https://developer.api.autodesk.com/da/us-east/v3/health/Revit/stats
{

  "p50QueueTimeMs": 106.72,

  "p95QueueTimeMs": 372.19

}
If there is no recent queue-time data for an engine (for example, no jobs in the window), both fields return -1.0 rather than a time value. Treat -1.0 as “no recent data,” not as a queue time:
{

  "p50QueueTimeMs": -1.0,

  "p95QueueTimeMs": -1.0

}
What matters is how the two percentiles move relative to each other.
Reading the queue phases:
- Queue starting to build: p95 rises while p50 stays flat. A growing minority of jobs are waiting for workers, while the typical job still starts quickly.
- Queue continuing to build: p50 begins rising too. The backlog is now affecting most jobs, not just the slowest tail.
- Queue time high: both p50 and p95 are elevated. The system is under sustained contention or short on capacity.
- Queue draining: p95 falls back toward p50 as the backlog clears.
- Queue time low: both percentiles are low. The system has spare capacity.
For example, you can poll this endpoint periodically and hold or throttle non-urgent batch submissions when p50 climbs, rather than adding load to a busy engine.
2. Job-level queue position (on August 10th 2026)
When you poll a pending workitem with GET /workitems/{id}, the response includes a new approximateQueuePosition field:
{

  "id": "a1b2c3d4e5f6...",

  "status": "pending",

  "approximateQueuePosition": 5

}
It’s a 1-based integer: “you are 5th in the queue for Revit.” Once your job starts processing, the field is no longer returned. Position is calculated fresh on each request, so you always see current state.
A few things to know:
- It can be null. While a job is pending,
approximateQueuePositioncan be null if the position cannot be determined at that moment. The job is still queued and will be processed normally. - It’s approximate and can move sideways. Position generally decreases as jobs ahead are picked up, but it may briefly fluctuate, for example if a job ahead of you is cancelled or requeued. That is expected.
- One queue per engine. Position works the same way regardless of the engine version you target. There is one shared queue per engine, not a separate queue per version.
Important: queue position is a health signal, not an estimated wait time. The job ahead of you might be a 30-second RFA file or a 10-minute Revit model. Position confirms that the system is processing jobs and yours is in line; it does not tell you how long you will wait.
What’s not changing?
- The same
POST /workitemssubmission flow - The same pricing model
- Your existing endpoints and parameters keep the same behavior; queue visibility only adds a new endpoint and a new field
- No required code changes for most integrations:
approximateQueuePositionis purely additive
The one exception: if your integration uses strict JSON parsing that rejects unknown fields, the new field will cause it to error. This is uncommon, since both the standard .NET and Node clients ignore unrecognized fields by default, but if you have opted into strict parsing, relax it to tolerate additive fields within the two-week window before the field ships. Nothing else you do today will change.
Getting started
Available now:
- GET /health/{engine}/stats: returns
p50QueueTimeMsandp95QueueTimeMs(recent queue-time percentiles, in milliseconds) for the specified engine.
Shipping on August 10th 2026:
- GET /workitems/{id}: will include the
approximateQueuePositionfield while your job is pending. We’ll update this post and the changelog the day it’s live.
Check the Automation API reference documentation and changelog for the latest status. No authentication or setup changes are required.
What’s next?
approximateQueuePosition ships in two weeks; watch the Automation API changelog for the exact date. After that, we’re gathering feedback on Phase 1 queue position to shape what comes next. For questions or feedback, visit the APS Get Help page.