
Previously, I added Leaflet maps inside the Viewer. This time, we’re going bigger: bringing real Esri terrain directly into the Autodesk Viewer. And not just imagery — we’re decoding Esri’s LERC elevation tiles into proper triangle quads for GeoThree.
But… why stop there?
Let’s crank the difficulty up a notch and add geo-drawing tools, complete with snapping, measuring, and real-world coordinates — all built with AI’s help.
Sure, the Viewer already has a snapping class and a measurement API. Snapping between points on a 3D model? Easy. Snapping between a model and real terrain? Not so easy. Calculating lat/long for every point and exporting clean GeoJSON? Even harder.
So how do we teach AI to do all this?
By giving it two small but powerful LLMS.txt files packed with the details it needs:
-
How Esri’s LERC compression and endpoints work
-
How GeoThree providers are structured (so AI can write new ones)
-
How to extend the APS Viewer’s measurement tool for terrain snapping
-
How to compute lat/long from 3D points using WGS84 anchors
-
And finally, how to turn all that into exportable GeoJSON
The result?
DEMO: https://wallabyway.github.io/geo-three-ext/
SRC: https://github.com/wallabyway/geo-three-ext
Two new Viewer extensions:
-
Geo.Terrain — (Part 1) Instantly adds real-world terrain to your 3D Viewer models
-
Geo.Tools — (Part 2) Because terrain needs UI. Here are a few buttons that will appear:
-
Two buttons that help align models to terrain
-
Draw 3D lines that snap and measure across elevation
-
Export the polyline 3D markers, into GeoJSON
-
...coded with AI-assistance, via these LLMS.txt files — this workflow, reduced my coding effort, from a month to just 3 days of iteration.
What This "Part 1" Covers — In 4 Parts:
-
Installing & Using the Extension
-
Adding Esri Raster Base Maps to GeoThree
-
How I decoded Esri’s LERC Compression into Terrain
-
Anchoring to a WGS84 tile, to fix the Viewer’s Precision Problem
Let’s dive in.
1. Initial Setup: Installing & Using the Extension
Start the APS Viewer with these two new "geo-focused" extensions in the config variable ('Geo.Terrain', 'Geo.Tools'):
Autodesk.Viewing.Initializer(options, async () => {
    const div = document.getElementById('viewer');
    const config = {
        extensions: ['Geo.Terrain', 'Geo.Tools']
    };
    const viewer = new Autodesk.Viewing.GuiViewer3D(div, config);
    viewer.start();
});
If you want Esri's height maps, then you'll need to include the LercDecode library (include it at the top, like this example). And lastly, import the js and mjs extension files, like so:
<script src="https://cdn.jsdelivr.net/npm/lerc@4.0.4/LercDecode.min.js"></script>

<script type="module">
import './geo-three.ext.js';
import './geo.tools.mjs';
</script>
2. Adding Esri Basemaps
The Geo.Terrain extension supports Esri’s public endpoints for raster tile base-maps:
new GeoThreeExt.ViewerMaps(viewer, {
  basemap: {
    type: "xyz",
    url: "https://server.arcgisonline.com/ArcGIS/rest/services/World_Imagery/MapServer/tile/{z}/{y}/{x}"
  }
});|
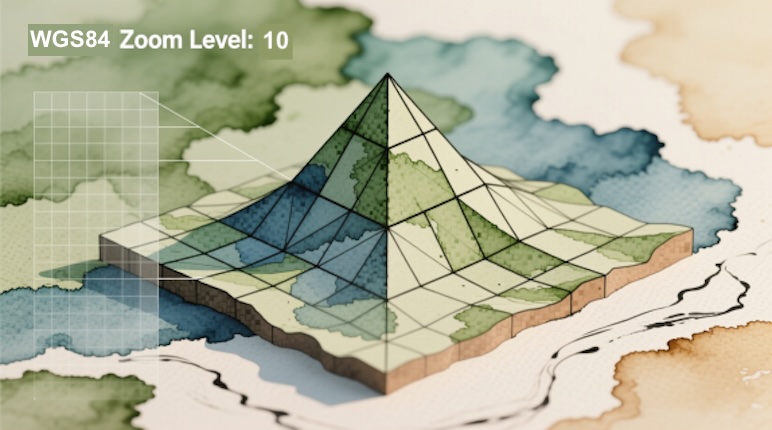
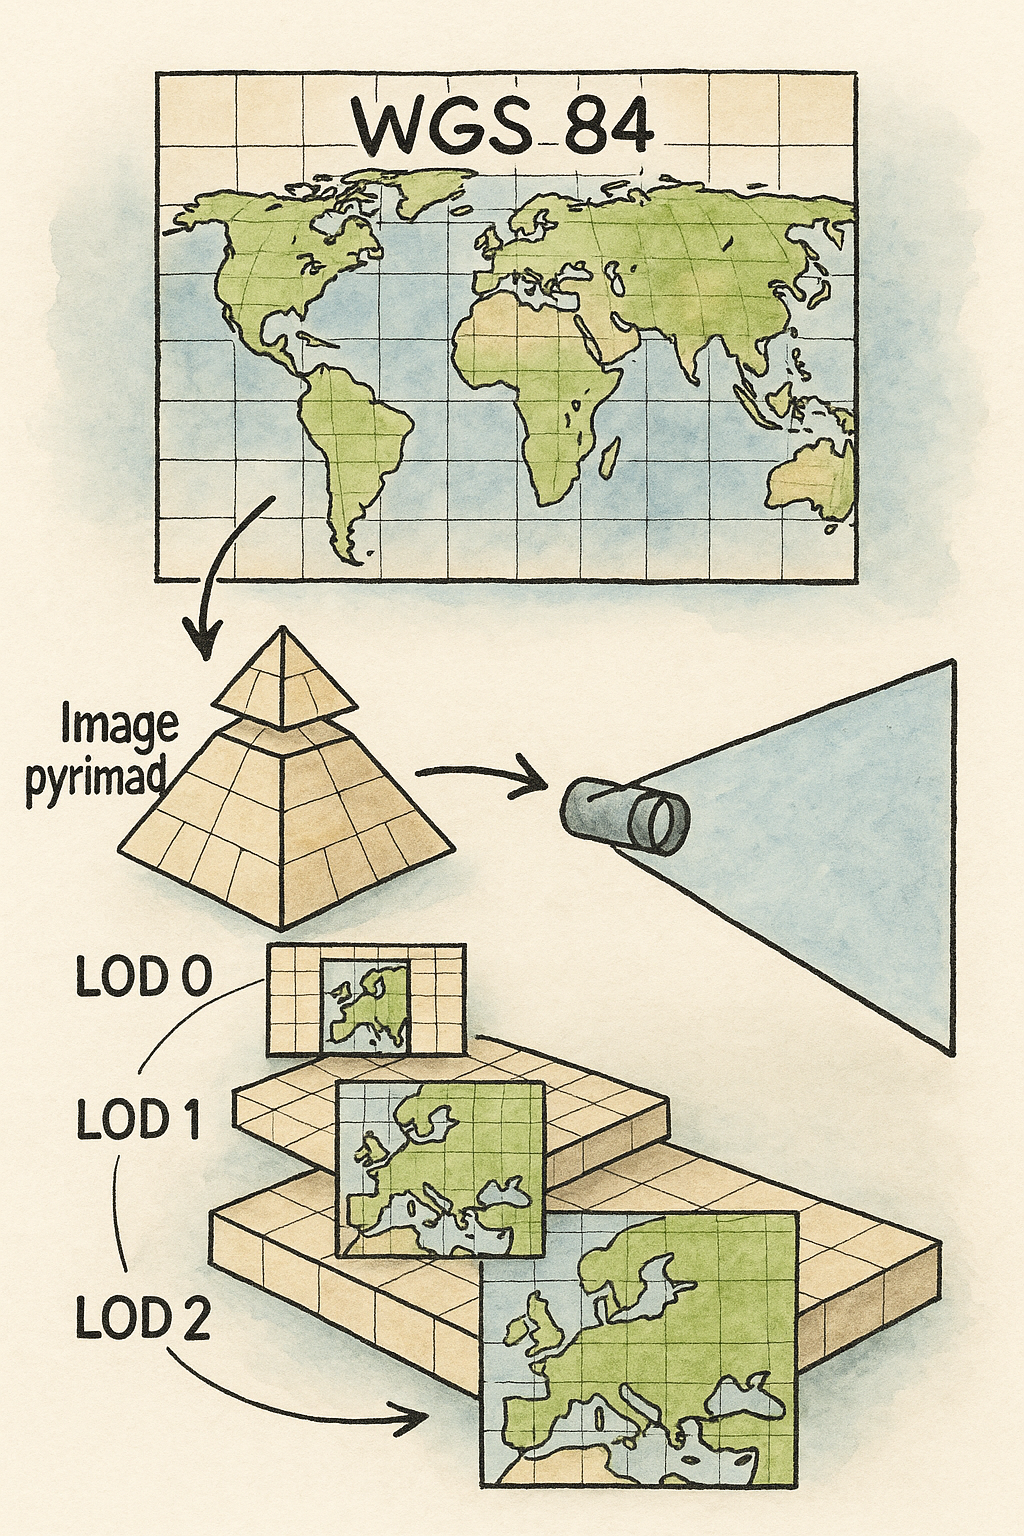
Explainer: Above is the endpoint for the raster image tiles, used to pull pieces of the image pyramid. On the right, is an infographic of how the image-pyramid works. Tiles are loaded into the scene based on the camera frustum. As the camera zoom's in, the LOD (level of detail) increases. Meanwhile, the camera target points to surrounding visible tiles around WGS84 lat / long. This is typically referred to as a "XYZ raster tile service". Refer to the terms 'leaflet' and 'WGS84' for details. Esri publishes several public basemaps as standard XYZ raster tile services. These work with GeoThree without any custom projection logic. Note: you can change the map 'style' by choosing one of the several Esri basemaps - just modify the GeoThree provider's URL with any of the following:
|
 |
3. Decoding "LERC" into Terrain
The Geo.Terrain extension also supports height map terrain. It adds a new geoThree height map provider, which decodes Esri’s LERC format into elevation data. First you need the right Esri endpoint, called the WorldElevation3D endpoint:
https://elevation3d.arcgis.com/arcgis/rest/services/WorldElevation3D/Terrain3D/
ImageServer/tile/{z}/{y}/{x}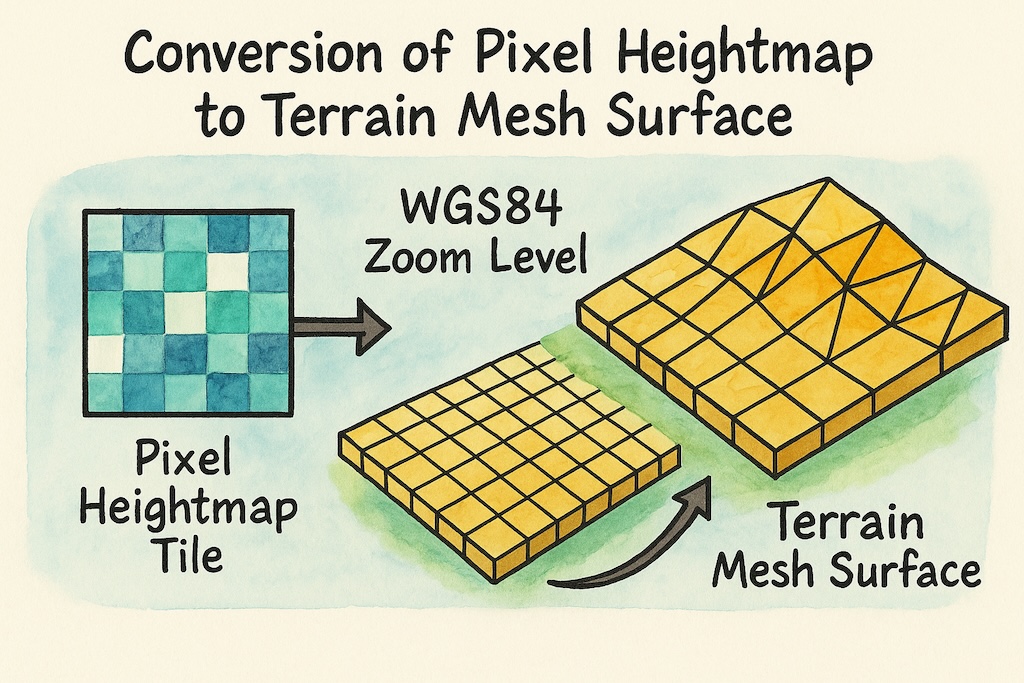
Next, what is LERC?
Esri's LERC format is an alternative to RGB height raster tiles and provides key benefits:
- Height stored as compressed binary floats (not RGB-encoded)
- Tiles are 257×257, enabling over-edge pixels for stitching
- The choice of encoding makes supporting slope maps, contour line shading, hillshade shadow maps, and precise normal generation, easier than RGB encoding.
LERC is simple enough to run on the main thread without a large performance penalty.
Using LERC Terrain as a GeoThree provider:
const terrain = new GeoThreeExt.Terrain({
  heightProvider: "esri-lerc",
  basemap: "esri-world-imagery",
});

terrain.attachTo(viewer);
Internally, tiles are fetched as binary data, decoded via LercDecode, converted to Float32Arrays, and used to displace a Three.js mesh (part of the GeoThree height provider).
I crafted an LLMS.txt file (see REF.md in the repo) from a public Esri 2018 talk. This markdown file guided AI to zero-shot the geoThree height-map provider, and iterated through a series of testing and implementation steps, via a plan.md file.
4. Precision: Anchoring to a WGS84 tile
WebGL fp32 precision limits become noticeable when coordinates get too large. ie. If you place two models into the viewer scene, with two opposing massive offsets, you will discover the famous "geometry jitters".
You can achieve the same thing by placing one model in London, and a second model in San Francisco. The offset between them blows out the webGL precision.
Now imagine if you use zoom level 0 (the entire planet is visible) in GeoThree, and do the same thing - you'll get "geometry jitters".
Recommendation: Start your terrain at approximately zoom level 7 or higher.
This keeps world coordinates small enough for stable rendering and allows BIM models to be positioned without camera jitter or geometry instability.
Unfortunately, it means you are limited to multi-model loading of a scene, that's within a 300km radius.
5. UI Tools: Model Placement and Alignment Tools
The Geo.Tools extension adds two alignment UI toolbar buttons. These are fun tools - highlighting the efficiency of AI assisted coding when given the right llms.txt file, that it can tackle incredibly difficult challenges like:
- hit-testing between model and terrain.
- adding the UX to handle a 4 step sequence (ie. a wizard)
- creating 3D UI with mesh-box geometry for the solid 3D lines, sprites for the dots, borrowed from the measure tool
- animations that move and rotate the 3D models into position (ease-in-out)
1. One-Point Move (Model Translation)
- Click a point on a model
- Click a point on the terrain
- The model is translated so the first point moves to the second
- Stored in
localStoragefor persistence
2. Two-Point Move / Rotate / Scale
- Select two reference points on the model
- Select two target points on the terrain
- The model is translated, rotated, and uniformly scaled to fit
6. More Tools: "Locator", "Polyline Draw" & GeoJSON Export
a. Map Locator Toolbar button
- Enter latitude, longitude, and tile zoom
- The terrain and basemap re-center to that location
- Includes sample predefined locations
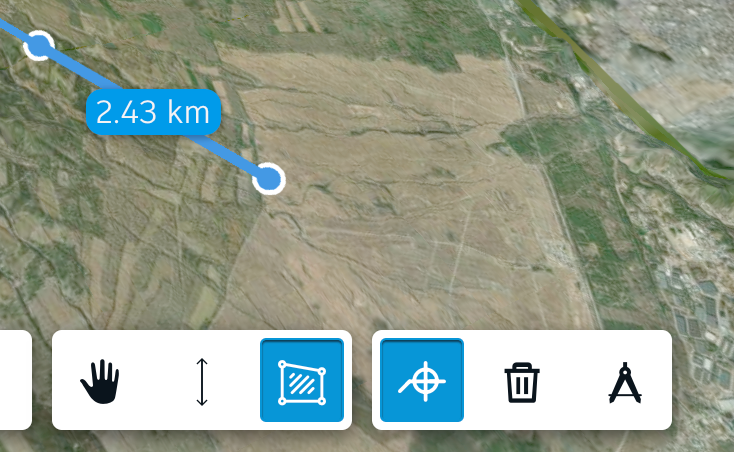
b. Polyline Draw tool
Adds three buttons, to let you draw a polyline in 3D. Specifically, the toolbar buttons also:
- Draw polylines directly on terrain
- Show distances displayed for each segment as a 3D label
- 'ESC' key to end drawing.
- Clear button, to delete your drawings
- Saved to browser localstorage, so they aren't lost if you refresh, or if you want to save these to your future database
import './geo-three.ext.js';
import './geo.tools.mjs';

const maps = new GeoThreeExt.ViewerMaps(viewer, {
  basemap: "esri-world-imagery",
  terrain: true,
  heightProvider: "esri-lerc"
});

const terrain = new GeoThreeExt.Terrain({ heightProvider: "esri-lerc" });
terrain.attachTo(viewer);

// Example: place a model using geographic coordinates
viewer.loadModel(urn, {
  globalOffset: maps.toWorldPosition({
    lat: LAT,
    lon: LON,
    elevation: terrain.sample(LAT, LON)
  })
});
c. GeoJson export tool
Finally, to take the polyline that you've just drawn, and export it as a geoJson file, click the "Export to GeoJSON" button. This will take the center tile of the scene (and WGS84 zoom level) and use that as an anchor to calculate the lat/long values of the polyline, to create the geoJSON. You can copy paste this geoJson into ArcGIS or any GIS tool, to see the result.
Summary
By combining the Autodesk APS Viewer, Esri terrain data, GeoThree, and a bit of AI guidance, we’ve stitched BIM and GIS into the same living, breathing landscape:
-
A world textured with Esri’s imagery
-
Terrain sculpted from LERC height data
-
Tools that let you align models to the Earth with pinpoint accuracy
-
Lines sketched across mountains and exported straight into GeoJSON
In the end, your 3D models stop being abstract geometry — they become geographic characters with real latitude, real longitude, and real stories. And the fact that this entire pipeline emerged from a few LLMS.txt prompts shows how far AI-assisted development has come: we can now build geospatial tools that used to take weeks… in just a few days.