Try the Demo Here / [SourceCode]
Update:
https://github.com/apprentice3d/ForgeViewerExtensions
for an AEC example
Overview
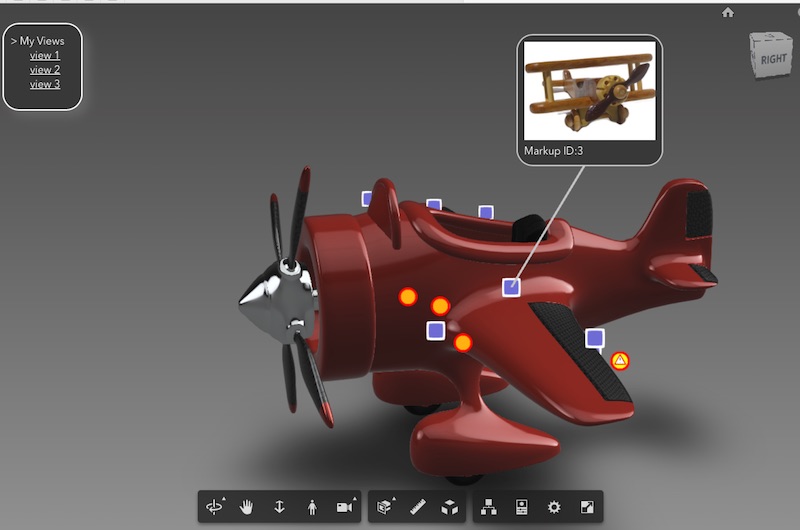
This is a simple 'extension' you can drop into your existing Forge Viewer project to add 1000's of 3D markup with multi-icons and a customized info-card.
With marker scaling, the markers appear to stick right on your designs. If you click a marker, it pops up your own custom pop-up dialog box with data from your favorite framework (jquery, React or Vue.js).
You can see a Video of it in action below:
Background:
I originally wrote this extension for the AR ConXTech demo (see http://vrock.it and original blog post) which needed to integrate with Vue.js.
Also, I needed to show 1000's of RFI's and Issues in a large Revit scene on a mobile device.
Traditionally you might use DIV elements for all those points, but that had performance problems on mobile after only a few labels / points. I needed 1000's of RFI's to appear.
So instead, I switched over to using a point-cloud shader with support for multiple icons (ie. a sprite sheet).
This point-cloud technique was first used in the Dasher project and later demoed by Philippe. My solution solves the mobile performance problem due to the minimal use of DIV containers.
The behavior is a little different from past solutions. Now, when you clicked on a point, you see a pop-up card appear. When you move around, it follows the point nearby. This is done with a 3D line and a single DIV element. You receive an event with position and markerID, and it's up to your own html code (Vue.js / jquery / React) to position it.
I also add point-scaling and multiple icon support. Let's take a look...
1. Multi-Icons:
![]()
To use multi-icons, I used a spritesheet and added this to the pointcloud fragment shader:
gl_FragColor = gl_FragColor * texture2D(tex, vec2((gl_PointCoord.x+vColor.y*1.0)/4.0, 1.0-gl_PointCoord.y));2. Point Scaling:
I also needed to scale the points so the points looked like they stuck to the object as I zoom in and out. I added this line of code to the vertex shader:
```
gl_PointSize = size * ( size / (length(mvPosition.xyz) + 1.0) );
```
3. Mobile Performance
...and finally, to get great performance on iPad and Android, I needed to avoid using too many DIV elements... now I just use one.
Now I can render 10,000 markers at ~60 FPS (see this video for higher quality)
_______________________________________________________________________
How to use:
Steps:
- Step 1. Add this to your `index.html`
<script src="markupExt.js"></script>
- Step 2. Load the extension after `onSuccess` event, like so...
    function onSuccess() {
        viewer.loadExtension("markup3d");
    }
- Step 3. Send your markup data via an event `newData`, like this...
// create 20 markup points at random x,y,z positions.

var dummyData = [];
for (let i=0; i<20; i++) {
    dummyData.push({
        icon:  Math.round(Math.random()*3),
        x: Math.random()*300-150,
        y: Math.random()*50-20,
        z: Math.random()*150-130
    });
}
window.dispatchEvent(
new CustomEvent('newData', {'detail': dummyData})
);
Note: icon integer corresponds to an icon in the spritesheet (see options below). For example 0="Issue", 1="BIMIQ_Warning", 2="RFI", 3="BIMIQ_Hazard"
- Step 4. Add a 'onMarkupClick' Listener
window.addEventListener("onMarkupClick", e=>{
    var elem = $("label");
    elem.style.display = "block";
    moveLabel(e.detail);
    elem.innerHTML = `<img src="img/${(e.detail.id%6)}.jpg"><br>Markup ID:${e.detail.id}`;
}, false);
- Step 5. Add a 'onMarkupMove' Listener
window.addEventListener("onMarkupMove", e=>{
   moveLabel(e.detail)
}, false);

function moveLabel(p) {
   elem.style.left = ((p.x + 1)/2 * window.innerWidth) + 'px';
   elem.style.top =  (-(p.y - 1)/2 * window.innerHeight) + 'px';
}
...and that's it ! Open your browser and try it out !
_______________________________________________________________________
Features and Options
1. Icons / SpriteSheet
Here are the current icons I use:
![]()
You can add your own set by changing the file `docs/img/icons.png`.
Note: The icon value corresponds to spritesheet position.
So icon #0="Issue", #1="BIMIQ_Warning", #2="RFI", #3="BIMIQ_Hazard"
2. Positioning your Info-Card
You can reposition the popup Info-Card offset using the following settings at the top of the `'docs/markupExt.js'` file:
this.labelOffset = new THREE.Vector3(120,120,0);  // label offset 3D line offset position
this.xDivOffset = -0.2;  // x offset position of the div label wrt 3D line.
this.yDivOffset = 0.4;  // y offset position of the div label wrt 3D line.
3. Adjusting the marker's 'Hit Radius' and 'Icon Size'
function markup3d(viewer, options) {
    this.raycaster.params.PointCloud.threshold = 5; // hit-test markup size.  Change this if markup 'hover' doesn't work
    this.size = 150.0; // markup size.  Change this if markup size is too big or small
4. Make Points appear 'in Front' with Transparency
If you want the markup points to always appear on top of objects, change the `depthWrite` from `true` to `false`. Also change the `impl.scene` to `impl.sceneAfter`. Finally, to make the points transparent, add opacity: 0.4 to the material shader.```
    this.scene = viewer.impl.scene;
// change this to viewer.impl.sceneAfter with transparency

    this.initMesh_PointCloud = function() {
         ...
         ...
            var material = new THREE.ShaderMaterial({
                ...
                depthWrite: true,
                depthTest: true,
Info-Card details

1. Line Color styling:
You can change the line color at the top of the `docs/markupExt.js` here:
function markup3d(viewer, options) {
   this.lineColor = 0xcccccc;
2. Info-Card Styling
The Info-Card colors and CSS styling can be found in the `docs/index.html` here:
        #label {
            display:none;
            position:fixed;
            z-index:2;
            border: 2px solid #ccc;
            background-color: #404040;
            border-radius: 25px;
            padding: 10px;
        }
        #label img { width:200px; }
Those 6 info-card pictures I used, can be found in the folder `docs/img/0..5.jpg`. When you click on an info card, the MarkupID associated with a point is used to display the corresponding JPG (I take a modulo 6 of the ID# just to demostrate the concept - you would pull thumbnails from your own database based on the markup ID returned).
The HTML string/template is generated by the main `'docs/app.js'`.
elem.innerHTML = `
<img src="img/${(e.detail.id % 6)}.jpg"><br>Markup ID:${e.detail.id}`;
Note: This is where you would add your own customized div with jquery, React.js or Vue.js, after you receive the 'onMarkupClick' event
Camera States, etc
Creating your own Camera Views
There's a custom menu in the top left with three camera views to click on. To create those views, follow these steps:
Steps:
- Set up your view state (set the pivot point (holding down ALT key), set the Environment, FOV, selection list, hidden list, etc)
- Go to Chrome Browser debug console
- Enter the following:
camViewportObj = viewer.getState({viewport: true});
JSON.stringify ( camViewportObj );
4. Copy and paste the resulting JSON, into the `'viewStates'` variable in `app.js` line67
Now use the restoreState() method to switch between custom views.
Render Performance Tips:
1. Reduce Pixel Density
On startup, use...
window.devicePixelRatio = 1;
Use a reduced pixel density, to get better render performance for a trade-off in pixelation. Noticable on retina screens like mobile and OSX laptops.
See the `docs/app.js` file for details.
2. Use Mesh Consolidation
    var options = {
        env: "Local",
        useConsolidation: true,
        useADP: false,
    }
Mesh Consolidation, groups similar meshes together to reduce draw calls - so for large scenes with many tiny parts, this will group these together and improve render performance.
_______________________________________________________________________
References
- Hit Test PointClouds: [StackOverflow]()
- Phillip's PointCloud: [BLOG]
- ConXTech AR Demo: [(http://vrock.it] / [BLOG]
Source Code for MarkupExt.js
...And that's a wrap!
You can find an example of how to use the extension on GitHub here: https://github.com/wallabyway/markupExt
Feel free to add any issues you find to my Github issues repo.
Remember to follow me on Twitter @micbeale.


