Follow me @augustomaia
It's quite straightforward to write an extension to View & Data, just write a custom code for load and for unload. You'll find several extensions on this blog, including this: Integrating a chart library, by Philippe Leefsma.
This post uses Philippe's sample and replaces the loadChartFromProperty to create charts using RGraph library. The code assumes the model is already loaded on the viewer and search for all properties on the geometries, so make sure you call loadExtension after calling load. For instance:
// Load the document (urn) on the view object
function loadDocument(documentId) {
    // Find the first 3d geometry and load that.
    Autodesk.Viewing.Document.load(
        documentId,
        function (doc) { // onLoadCallback
            var geometryItems = [];
            geometryItems = Autodesk.Viewing.Document.getSubItemsWithProperties(doc.getRootItem(), {
                'type': 'geometry',
                'role': '3d'
            }, true);
            if (geometryItems.length > 0) {
                _viewer.load(doc.getViewablePath(geometryItems[0]), null, function () {
                    _viewer.loadExtension('Autodesk.ADN.Viewing.Extension.Chart.RGraph', '');
                });
            }
        },
        function (errorMsg) { // onErrorCallback
            alert("Load Error: " + errorMsg);
        }
    );
}
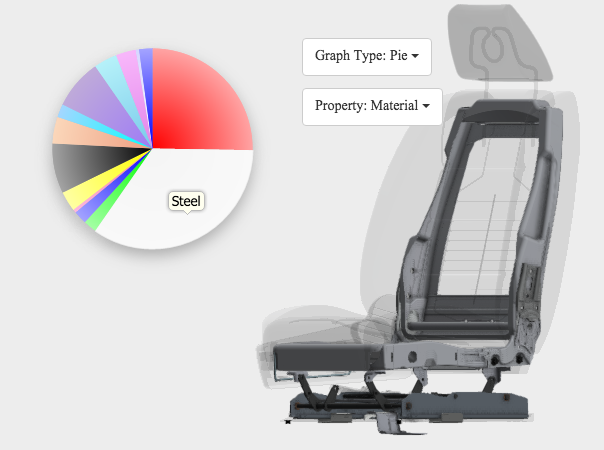
Here is what the result should look like. See code below (hosted on Github)
See code below (hosted on Github)


